PanSensic Micro Case Study #1: Electric Toothbrush

In a no doubt vain attempt to show that not all Big Data Analytics capabilities are the same, I thought I’d instigate a series of ultra-short case studies to hint at the sorts of thing our PanSensic tools have been designed to do. Like any BDA toolkit, PanSensics works best when we feed lots of data into the engine. That said, we occasionally even impress ourselves with the richness of the insight that can be gleaned from briefest of narrative data.

This first micro-study involved a scrape of Amazon reviews on electric toothbrushes. Including this one:

5.0 out of 5 stars Efficient, 25 April 2014

This review is from: Philips Sonicare HX6731/02 HealthyWhite Deluxe Rechargeable Toothbrush (Personal Care)

The first brush proved to be faulty after two weeks; however, when I returned it, the replacement was sent straight away and I received it four days after sending in the original product. The Sonicare does an efficient job of cleaning my teeth and, best of all, the timer forces me to spend two and a half minutes on my brushing and polishing. Before I got the product I used to spend a cursory half a minute on my morning and evening ritual; I have currently noticed a brighter smile and a cleaner feel to my teeth. Now I can follow my dentist’s recommendation and won’t feel guilty at my regular visits.


Normal (Level 1 or Level 2 on our BDA Capability scale) analysis of this review would tell you this consumer is happy.


PanSensics will tell you:

  1. This person is naïve, an ‘innocent’
  2. Impulsive
  3. Needs to see data to be convinced
  4. Is actually quite angry
  5. That there’s a significant ‘clean faster’ innovation opportunity
  6. Probably won’t buy a Sonicare next time

If you’re interested in finding out how PanSenic is able to make this assessment, check out the website and give it a go yourself.

Big Data Data

blog bda

With some commentators suggesting that the Big Data Analytics industry will do over $20B of business in 2015, it feels a little duplicitious to suggest anything other than that the industry has become an enormous success. On the other hand, perhaps ironically, it would also appear that the industry is not so good at measuring the tangible success it is delivering to its customers. Or maybe the truth is they don’t want to know.

My suspicion is that were anyone to calculate anything like genuine, meaningful Return On Investment outcomes, we’d discover that the actual value being delivered to customers is somewhere close to zero.

It all depends on how the calculations get made of course. Take my visit to Amazon yesterday to purchase a book someone recommended I should read. As ever, not long after I’ve found the book in question, Amazon is hard at work recommending other things that I might like to buy. ‘If you like that book, we think you’ll like this one even more.’ The fact that I agreed with them on this occasion is very likely to have the Amazon Big Data analysts claiming another success story. They successfully pointed me towards a book I didn’t know about and offered it to me at a price that, after I’d done my usual due diligence check, made it feel like an easy purchase decision. But was this really a Big Data success story? Or was it merely getting me to an important book I’d didn’t know about sooner rather than later?

The heart of the problem here is how the Big Data world takes account of the foibles and complexities of customer minds. And therein lays the real problem with today’s Big Data analysts. They’re good at analysing easy to access data (25% of people who bought this book also bought this one) but they have little or no idea how complex systems work. And particularly the rather awkward matter concerning the inextricable links between what we measure and the solutions that are expected to result. You can only know what to measure, in other words, if you know what the response you’re trying to design is going to look like. Designing measures in a complex system involves a classic chicken-and-egg conundrum. If that sounds counter-intuitive to you, you only need to think about a typical design cycle to see that, woah, it’s a cycle. The head connects to the tail so that no-one knows where the head is any more. Some projects might start with a measurement, but others might equally well start by guessing a solution and then measuring what happened to it.

siddar 3

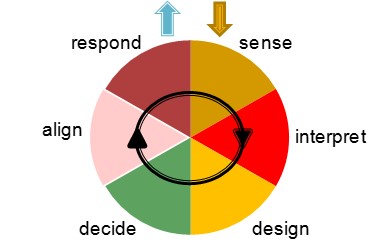
In the world of complex systems it is not good enough to be merely good at ‘Sensing’. You have to know how to Interpret, Design a response, Decide that it’s appropriate, Align the team and then execute a Response.

The ‘system’ requires all these elements, but the two that demand the polar opposite set of skills are Sensing and Designing. One is about analysis; the other about synthesis. Because the Big Data world tends to attract the former, it tends to be awful at the latter. The problem usually then becomes exacerbated because the Big Data analysis work is often out-sourced from the client organisations that are going have to do something with the results. Now you have a situation where the Analysts and the Synthesists are on opposite sides of a big silo wall. And so the blind find themselves being lead by the ignorant.

The point of this rant? With our PanSensic toolkit the Systematic Innovation team now finds itself sitting in the middle of what feels like a very crowded Big Data Analytics space. Aside from the cool measurement tools we’ve been able to build, I humbly suggest that our main uniqueness when we’re working with our clients is that our DNA sits on the Designer/Synthesist side of the spectrum. We spend most of our lives designing solutions. And because that’s where we come from, that’s what’s allowed us to gain the insight we have into knowing what the ‘right’ things to measure are.

99% of Big Data measurmeents, by our reckoning, are completely pointless because they offer zero insight into what design levers need to be created or pulled to make a difference. Hospitals spend millions measuring A&E waiting times, railway operators spend their millions calculating how punctual their trains are, supermarkets spend their millions measuring what went into my trolley this month, but all three measurements are thoroughly pointless when it comes to presenting any actionable change response. All their beautiful graphs, especially with the hospitals and railways, merely serve to frustrate both staff and customers, because none of us can see any kind of connection between the result and any kind of lever in or around the system that we can adjust to make the results look better next month.

So, how about this as a potential way through the rat’s nest of Big Data Analytics conundrums. A suggested trio of questions a leader should ask prospective Big Data providers before they write their Big Data Cheques:

  1. Show me evidence to demonstrate that you understand how my business operates as a Complex Adaptive System
  2. Show me evidence of success stories from other clients where you are able to demonstrate a clear information flow path and cycle time from measurement through Interpretation, (especially) Design, Decision, Alignment and a successful Response.
  3. Show me evidence of a back-to-back, double-blind trial in which your Big Data Analytics approach was demonstrably better than the placebo.

And, by way of a final coda, if they think they can answer questions 2 and 3, it probably tells you they didn’t quite understand Question 1.


Measuring Service innovation

In the spirit of not re-inventing wheels, the SI research team have spent some time in recent months looking at how the service industries measure their innovation activities. To say that search has ended in disappoint would be something of an understatement. Put crudely, no-one in or around the service sector seems to have the first idea how to measure the impact of their innovation efforts. What does exist seems to fall into two basic camps. In the first camp, ‘measuring service innovation’ seems to mean surveying people in the service sector to see how well they think they’re innovating. This seems like a fundamentally flawed way of doing things to me. Firtly because the survey instruments don’t define what they mean by innovation, and secondly because it’s difficult to imagine a scenario in which respondents would have any desire to answer the questions honestly. All in all, the whole exercise resembles a study asking gamekeepers to rate their poaching abilities.

The second service innovation measurement camp appears to have worked out that it’s a difficult problem and that ‘somebody should do something about it’. The most pro-active members of this camp appear to have tried running competitions to see if anyone is up to the challenge. As far as we can tell, no prize money has been handed out.

Given that the GDP of many developed nation is now heavily dominated by the service sector (in the UK, US and Australia it’s already over 80%) it somehow seems a little odd that no-one knows how to measure their future lifeblood.

In these kinds of situations, we’d normally expect to begin solving the problem by trying to define what the ideal solution would look like. Based on our definition of innovation as ‘successful step-change’, a meaningful measurement ought to be based on an ability to define and measure ‘success’. This might mean return on investment – something like ‘how much did we invest in creating our new service offering, versus how much did we get back in terms of new revenue from customers – or some form of net value addition. Or jobs created. Or maybe even money saved. All sound both logical and plausible. Except for a couple of awkward facts. Firstly the fact that the service sector is inherently embroiled in and surrounded by complexity. Which means that it is difficult if not impossible to reliably connect causes and effects. Any change made to a complex system is prone to a host of unintended consequences. One part of the system, in other words, might get rewarded for successfully getting butterflies to flap their wings faster, while another ends up becoming the victim of a surprise hurricane. A bit like when the UK Government ‘innovated’ after the 2011 riots in London and locked up the gang leaders. A big tick in the ‘no more gang leaders’ box. A big disaster for everyone else when the power vacuum left in the gangs created a mass of new work for the police trying to calm the ensuing intra- and inter-gang warfare.

Secondly, and perhaps even more significant, is a recognition that a very large proportion of how customers decide whether the ‘innovative’ new services they’re offered are ‘good’ or not are driven by intangible, emotional factors. Which in turn creates the new problem of how on earth can we reliably measure intangible things like ‘wow’, trust, happiness, empathy or any of the other factors that might driver a change in customer behaviour?

It is, of course, the main motivation behind our PanSensic tools and our philosophy of helping organisations to measure what is meaningful rather than merely convenient. In terms of measuring service innovation, PanSensic tools are able to measure a host of different elements that might, individually, collectively or in some combination help organisations to measure how well their service innovation activities are going. Things like:

  • Number of ideas being generated
  • Quality of ideas being generated
  • Number of ideas being executed
  • Reduction in customer frustration
  • Increase in customer Autonomy, Belonging, Competence and Meaning
  • Increase in customer trust
  • Improvement in staff engagement
  • Emotional ROI
  • Increase in customer propensity to recommend to other prospective customers
  • Etc

Before we get too far ahead of ourselves, we’ve perhaps now revealed a new problem. Namely which of thes and the host of other things we could add to the list is more relevant than others? Where should an organisation start? What should they be aiming for?In classic bad-consultant language, the answer is – sadly – ‘it depends’. Fortunately, we know there are two things that dominate the answer to this dependency question. The second most important, is the Innovation Capability Maturity Level of the organisation making an innovation attempt. Level 1 companies will generate success by taking on Level 1 projects, and measuring things relevant to their Level 1 capabilities. When an organisation advances to Level 2, how they measure success will change. And it will change again when they hit Levels 3, 4 and 5. In each case what they should change to has been mapped and verified over the course of building the Capability Model over the course of the last eght years.The most important dependency determining factor, and in many ways the thing that forms the underpinning DNA of the Innovation Capability Maturity Model research is that the most important service innovation measurement parameters are those that enable the appropriate ‘innovators’ to see that they are moving in the right direction. Only when people feel like and can sense that they are doing the right things and moving in a positive direction are they likely to keep going. Service innovation measurement job one, therefore, is providing whatever is needed to visibly show the do’ers and their supervisors that progress is being made.


A Crash Course In PanSensics

“Only Connect”

E.M.Forster

The science is unequivocal: The simplest, most effective way to create sustainable change – in either yourself, your team, or the enterprise you run – is to create and maintain a sense of meaningful progress. People moving in the right direction stay moving in the right direction.

The problem is this. We only know we’re making progress by measuring something, and measuring the meaningful stuff is really difficult. The large majority of change initiatives fail because someone, somewhere made a decision to measure what was easy rather than what was important. So-called ‘Big Data’ is just a massively amplified version of the same issue. Computer technology has meant we’re able to measure more and more of the wrong things, adding more and more hay to the haystack, and as a consequence making the needles even more difficult to find.

We’ve spent the last twenty years working with clients across every walk of life to build reliable ways of measuring things we know are important. How much does my customer trust me? How engaged are my staff? Will people go out and buy my stunning new product? You name it, we’ve found a way to measure it. In an attempt to spread the word, we’ve published a host of papers and articles on how we’ve done it, and case studies showing the benefits we’ve been delivering for our brave, early-adopter clients.

Then we hit a new problem. There’s always a new problem. That’s one of the reasons a ‘sense of progress’ is so vital. Our new problem became, how to describe our ability to measure just about any of the important things in life, to people that are overwhelmingly busy? And how to do it in less than 1500 words?

So, we said, let’s try and find a scenario that we can all connect to and see if that helps. Think, for example, about the last time you had to write something important. A proposal for a customer, or weekly report to your boss, or a complaining letter to the local council, or a big thank-you to the local hospital for looking after you so well.

It’s an important piece of communication and you want to get it right, so you do the best job you can writing the words you think will achieve what you want to do. Get the contract, get a tick in the box towards your annual KPIs (even if they’re an archetypal example of a terrible, terrible measurement instrument!), get the council to fix the problem, or maybe just bring a smile to the lips of the ward sister.

What’s the process you’re going to go through to achieve your aim? Make a first draft? Check it? Get someone else to check it? Maybe – radical thought – picking up the phone and having a conversation with your intended recipient to try and gauge where their mind is at? Or – more likely – go and look at one you did earlier to see if it has any clues to offer. Pretty soon when you think about this question, you realize you’re essentially flying blind. You have no idea whether the words you’ve just spent your precious time laboring over are anywhere close to what’s needed to get the outcome you’re after.

So maybe, you think to yourself, the phone conversation option is the thing to try. Or possibly even a face to face meeting. I think we know you’re probably not going to do either unless it’s a really, really important job because there’s another million and one things on the catalogue of jobs that also need attending to, but let’s imagine we did. Now we have a new problem. To para-phrase J.P. Morgan, the new problem is that people say things for two reasons, a good reason and a real reason. So during our conversation, what we hear, and what the person’s actually thinking – the stuff that in reality is going to drive their behavior – are potentially two very different things.

blog pansensic


Capturing the good reason stuff is easy. It’s all the quantifiable stuff that has come from our conscious mind. My poor old friend Nick, for example, drives a Porsche. If you ask Nick why he drives a Porsche, he’ll spend as many minutes as you’ll allow him extolling all the virtues of the finest automotive design skills on the planet, the acceleration rates, the horsepower, the latest exotic piston ring coating materials, you name it. What he’ll find much more difficult to describe are the real reasons he bought the car. His increased ability to attract members of the opposite sex for example, when he parks conveniently next to them in a car park. The ‘real reason’ stuff is really difficult to capture because it’s cheesy or embarrassing or sounds trite, or – most commonly of all – it happens so automatically we’ve ‘never thought about it’ or realized before.

So does this mean we should give up? Usually, yes. But from a PanSensics point of view we’ve now found the beginnings of what we mean when we talk about measuring what’s important. What’s important in this case is all the ‘real reason’ stuff that’s happening between the lines of all of the (largely irrelevant) ‘good reason’ content.

Think about this for a second. Every second around 11 million bits of information flows in to the average human brain from our various senses. About 40 of those bits go to our conscious brain, the other 10,999,960 go to our pre-conscious. The vast majority of the decisions we make get made in this pre-conscious part of the brain, before the trickle of data entering our pre-frontal cortex has had any chance to be interpreted and acted upon. By the time we decide to do something or say something, for the most part our pre-conscious mind has already done the heavy lifting and has decided for us. All the ‘good reason’ words we use when we’re arguing our case or exercising our social skills are the ones that come from our conscious brain. All the ‘real reason’ stuff has been decided in our pre-conscious, before our conscious brain has even got its shoes and socks on.

If that’s the important stuff, we can’t afford to ignore it just because we can’t measure it on a Likert scale (Public Enemy Number One when it comes to meaningless measurements). The pre-conscious stuff is the pot of gold at the end of the rainbow. We need to be able to interpret what’s happening before our prefrontal cortexes have had a chance to mangle and distort it. That was the starting premise of the PanSensic capability: build a science of pre-conscious brain ‘reading between the lines’.

So now step back a second. Assume that PanSensics is able to do that ‘between the lines’ job. It’s a big assumption right now, but go with it for a few seconds. If it was possible, what would you really like to be able to measure in order to give yourself the best possible chance of achieving your desired aim when you press that Send button that will release your words out across the ether?

The mood of the recipient maybe? Are they happy? Angry? Stressed?

What are their ‘hot buttons’?

What should I avoid saying?

Are they open to change right now?

Do they like me?

How genuine are they?

Are they a morning person? When would be the best moment for my mail to arrive?

Ultimately, per the E.M.Forster quotation, it all boils down to what do we need to say and what tone should we use to ensure we really connect?

Now contemplate the possibility that all these things, and any other ones that might have flashed in front of your mind just now, are not just measurable, but measurable in a repeatable, verifiable, validate-able, meaningful fashion. Really.

Like I said earlier, we don’t expect anyone to believe whatever claims we might be making for the PanSensic capability. The only thing that will – or should – convince anyone is tangible (measurable!) proof that it works for them in their context. Which then gets us back to the ‘we’re all really busy’ problem. So here’s how we get to kill two birds with one stone. The next time you have that important email or proposal to send out, just before you press ‘Send’, you paste a couple of things into the PanSensic ‘Empathy Sensor’ at … https://akumenapp.com/k2o/compareemails.php

… and see what it has to say.

No cost, almost no time (the PanSensic engine is doing some pretty sophisticated calculations so it might take a few seconds, especially if you’ve pasted a lot of text into it, sorry), no registering your contact details, we promise we will not save or look at any of the text that you paste, and ‘no salesman will ever call’. If we’ve done our job right, there’s only up-side, and that is you receiving a unique insight into how well your important email is going to connect. Oh, and, what you might like to do about it if you’re missing the mark in some way.

End of crash course.

Except maybe this final thought. One for the real skeptics out there. Think back again. Think this time to a correspondence you had in the past that didn’t have the effect you wanted. The car-crash email. Paste that into the PanSensic tool demo (https://akumenapp.com/k2o/compareemails.php) and see if the results help you to see – for the first time – why things ended the way they did. We think you’ll be impressed.

Predicting The Future Of A Generation That Has Only Just Started To Hit Their Teens?

(These words formed the initial draft of the first chapter of the GenZ book we contributed to earlier this year – http://www.happen.com/48-hr-book/download-the-48hr-book. Page number limits ultimately meant it didn’t fit… so it’s now here instead.)


“At bottom every man knows well enough that he is a unique being, only once on this earth; and by no extraordinary chance will such a marvellously picturesque piece of diversity in unity as he is, ever be put together a second time.”

Friedrich Nietzsche

or

“There are only 40 people in the world, and five of them are hamburgers.”

Don Van Vliet (Captain Beefheart)

How and why does each of us grow up to be a unique individual? Are people’s characters fixed early in life or can they change as adults? How will our collective characters affect the future? What will the stock market be doing in two years’ time? In five? In ten? What products and services will people be buying? What won’t they be buying any more? How can parents best prepare their children for the future? What should they be doing for them? What should they not be doing?

We, all of us, like to know what’s around the corner. The human brain is, in effect, a prediction machine. Albeit one that only tends to look forward a short distance before our powers of deduction fail us. Some purport to do the job better than others. Some even write books about what the future will look like. Sadly, some of the things that emerge from these predictions tend to come back and haunt the authors. Heavier than air machines will never fly, there’s a global market for about a dozen computers, no-one will need more than 64K of computer memory. The inability of even the experts closest to their subject to get it right is the stuff of gleeful legend. To the extent that, if anyone approaches us claiming to be able to see into the future, our best course of action is probably to cross the road and get as far away from those people as possible.

So why are we now about to do the same thing?

Well, first up, at the very least, we’re strong believers that planning for the future is important. Even if the plan that emerges ends up with a relatively short shelf-life. Secondly, because we’ve been working at this problem for the last 20 years now, we think we’ve learned a few things about the way things evolve that allow us to do a better job of mapping the future than anyone else out there. Not that that is necessarily saying very much. If the finest minds on the planet can’t do it, what chance have we got?

Actually quite a big one. It’s a chance that starts from an idea we all carry to some extent: just because we can’t predict everything about the future, doesn’t mean that we can’t predict anything. For some reason, the world seems to have developed a depressingly black-and-white view of futurology, when in reality it’s a million different shades of grey.

Some aspects of the future are nigh on guaranteed. The number of babies born into the world this year, for example, gives us a pretty good indication of how many primary school-age infants we will have in five year’s time. And a strong set of clues about the extent of government services, the number of doctors and nurses and the amount of food and water we will need for the next 80. But somehow our governments seem to be surprised when these kinds of things pan out the way they do. We might think of them as ‘inevitable surprises’.

Beyond these ‘inevitable’ things then come a bunch of things that are to some degree calculable. It’s difficult to know with any kind of certainty, staying with the primary school theme, precisely how many parents will decide to home-school their precious offspring, but that’s not the same thing at all as being able to make some kind of meaningful calculation based on past patterns of behaviour.

And that’s where the methodology underpinning this book comes in to play. There are a host of patterns that we can look back through time and see playing out time and time again. We can also see that there are times when they don’t. Traditionally, that’s when these kinds of prediction stories come to a sticky end. The real trick is knowing why sometimes patterns repeat and sometimes they don’t. That’s the underpinning ‘DNA’ of our research, and the heart of what we’ll reveal about Orkids in this book.

Look back through history – whether it be decades or centuries – and one of the things you can observe are a host of oscillatory patterns. Between left and right wing governments for example. Or between economic boom and bust. Centralisation and decentralisation. Individual freedom and collective responsibility. Gender difference. Or between baby-booms and baby busts. These oscillations keep occurring so long as no-one tackles the underpinning conflicts and contradictions that create them. Example. The NHS has recently undergone another traumatic re-organisation and shift of power away from ‘managers’ and back to ‘clinicians’. In addition to being traumatic for those involved, it’s a shift that has already been massively expensive in both cash and patient care (or lack thereof) terms. Crucially, too, all it has done is shifted the same basic problem from one side of the trade-off back to the other. And because that’s all that’s happened, we can make a fairly safe prediction that at some point in the not too distant future, the pendulum will swing back in the other direction.

Here’s another one. If you’re a parent with young children right now you’re very likely to have them on a pretty short leash. It’s a good idea to know precisely where they are and what they’re doing at any moment in time. If only because all the stories you hear in the media tell you this is what parents are supposed to do. Go back 40 years though and parental attitudes were very different. Some of the members of this team of authors were practically feral when they were kids. If you’d’ve asked those parents where are your kids, they would very likely have shrugged their shoulders and speculated, ‘out playing?’ Which is not to say that those parents loved their kids any less, but simply that what we’re seeing is two ends of the same pendulum. The fundamental contradiction between looking after our children while simultaneously providing them with the skills they need to, later, survive as adults in the big wide world still hasn’t been solved. And probably won’t be for a good long while yet. Which in turn means we can make a fairly safe prediction that parental-leashes will start to lengthen again in the future. The only uncertainty here is when?

And, we propose, even that answer is mappable with a fair degree of precision. A precision based on a (painfully gathered) understanding that the ‘pulse rate’ of many things in society is dictated by a generational transfer of behaviours from one generation of parents to the next generation of offspring. The way you were raised by your parents, in other words, will later on affect the manner in which they will raise their own.

That’s the first strand of the basic bottom-up ‘DNA’ of the model we use in this book. The way in which you the individual reader reading this paragraph were raised by your actual parents will influence the way you are or will raise your own offspring. Like your parents, you too are unique. Just like everyone else in your group of friends and peers. And that’s the next strand of the societal DNA… it’s difficult for any of us to stand out too far from those peers. In no small part because the media keeps reminding us that it can be a pretty lonely place standing too far away from the crowd. Society, in other words, has a way of putting in place correction mechanisms that mean we all tend towards a self-organising average.

The third and final strand of DNA holding this book together is an understanding of complex systems, and specifically the idea of emergent behaviour. What this translates to in practical terms is that there are a whole bunch of random events that occur in the world, some of which will quickly fade into insignificance while others will come to change all of our behaviours. ‘Shit happens’ was the oft used phrase of the 80s, but society’s reaction to whatever shit it might be is very strongly conditioned. And, moreover, is most often conditioned by our generational cohorts. Of which, contrary to the suggestion of Captain Beefheart at the start of this chapter, it turns out thus far that there are only four. Only one of which is a hamburger.

Children, to move on swiftly before we get into an argument we don’t want to start, have been the subject of kidnappings since humans evolved to live in tribes. Thousands of children a year are kidnapped. But if you look back through the last hundred years only two seem to have stuck in the collective memory. Today, it doesn’t matter where you are on the planet, people know the name Madeleine McCann, and the fact that poor little Maddie still hasn’t been found. The other name is Charles Lindbergh Jr. Okay, you may not have heard of him, but we all still remember his father, the first man to fly solo across the Atlantic. Back in 1932, though, it was the kidnapping of Lindbergh’s son that had the global media in the same Maddie-frenzy we see today. The fact that Lindbergh Jr and Madeleine McCann are precisely four generations apart is, we propose, quite significant. Out of all the thousands of kidnappings that take place, these are the ones that hit a moment in time when the world was at its most receptive to media messages reminding parents that the world is a dangerous place, and you need to keep your eyes on your precious little ones at all times.

Here’s another one. September 11, 2001. A day when, no matter where you lived, the world changed. Its four generation ago equivalent was the Wall Street Crash of 1929. Again, events can happen at random, but society’s reactions are strongly conditioned by generational effects. Both 9/11 and the Crash – two quite different (random) events on one level – ended up having the same basic trigger effect on societal patterns. 9/11, indeed, proves to be particularly significant as far as this book is concerned. Many things changed ‘post 9/11’, but one in particular was the behaviour of parents. A baby born into this new world was a baby born to parents who now had tangible evidence that the world was a dangerous place. A dangerous place that meant a significant shift in parenting behaviour towards making sure our kids were safe at all times. 9/11 turned out to be a significant generational turning point. And, in a classic case of ‘you reap what you sow’, we’re just about to start experiencing some of the consequences of that shift in parenting behaviour. The oldest of those post 9/11 babies hit their teens this year. And as such – no matter what their suffocating parents might think about it – they begin to start making their own way in life. Making their own decisions and doing what they want to do rather than what their parents might desire. And that’s precisely why we’re publishing this book now. Sure, we’ve been researching this subject for the last 20 years, and sure too that research will continue for the foreseeable future, but the reason for embarking on a ’48 hour’ book writing blitzkrieg is that moments like this only occur once every four generations.

Now, we don’t know about you, but if anyone comes to us trying to tell us that our Society emerges from a bunch of patterns that somehow keep repeating every four generations, no matter how hard they might argue their case, we’re still unlikely to believe them. That’s why our entire research rationale for the last 14 years has been to try and dis-prove the model. The fact that – no matter where or when in the world we look – we’ve as yet failed to do that means that we’re happy to present some of the things that come out of applying the model. One might say were at the stage of believing ‘all theories are wrong, but some are useful’. We know ours is at the ‘useful’ stage because we’ve been working with clients from literally all walks of society in just about every region of the world helping them to design and deliver what we can now rightly claim to be billions of dollars of new revenue and hundreds of millions of dollars of bottom line savings. The model, in other words, has been verified and validated in the only meaningful manner possible: did it tell us something that allowed us to create deliver a successful step-change to our clients.

It’s not the job of this book to describe all of the underpinning research to readers. Any that want to delve deeper might like to explore one of our TrenDNA or GenerationDNA texts. The job of the book is rather to reveal clues and insights into a specific emerging generation of what we’ve come to think of as Orkids. In the next chapter we’ll share enough of the model to show readers why and how this generation will be classified as ‘Artists’ and what this means for the next twenty years of their evolution. After that the focus shifts to the construction of a description of likely characteristics of the Orkids and, then, to some of the likely implications, threats and opportunities for parents, teachers, government officials, product designers and marketers.

We realise, almost finally, that there are sceptics out there (hello, Generation X readers!) who wouldn’t believe this stuff even if they’d lived with us for the last 14 years. To them we say, it’s great that they bring that scepticism to bear on the words to come in the rest of the book. We’re not asking anyone to ‘believe’ every word of what we write. What we are asking is that, at the very least, you use our thoughts as provocations, stimulus and some perhaps far-fetched sounding clues to base some of your future scenarios around. Insight, we firmly believe, comes from contradiction. It is, therefore, the places where you find yourself disagreeing most vehemently with our projections, where the greatest innovation opportunities exist.

Finally, by way of a health warning for those carrying an upbeat, glass-half-full view of the world (hello, Generation Y readers!), a lot of what we’re suggesting is likely to occur in the next twenty years isn’t good news. Not for our Orkids or the world they are about to begin exploring for themselves. The next ten years, our model suggests, is likely to see the calm-to-crisis pendulum swing even further into the direction of ‘crisis’. Some people won’t like to read these words. We write them for two reasons. Firstly, in any crisis period there are always winners, and you’re more likely to be one of them if you have your eyes open and know where and how to look for the inevitable opportunities. Second, and more important, knowing that complex systems are emergent, we also know that the crisis isn’t inevitable. Or, if we’re already too late to prevent it from happening, at the very least, we might – collectively – be able to change sufficient small things to create a momentum that mitigates the worst of it. Our Orkids are depending on us.

Big Data Capability Levels

Well, it was always going to happen, but the world of Big Data has recently very likely hit its peak of over-inflated expectations on the Hype Cycle. We know this because every one of the Big Five consulting leviathans has had to create their own special version of ‘social intelligence’, ‘BigInsights’ or ‘Big Decision Analytics’. Large multi-national players get away with these puffed-up offerings largely because they know there’s an enormous market of managers and leaders who a) have been told Big Data is the future, b) don’t really understand what it is or means, and c) know that if they buy a Big Data package from a Big Five player and things go (inevitably) wrong, they can turn around to their bosses, shrug their shoulders and say they did the best they could. This is how the world of over-inflated expectations works.

Matters will right themselves soon enough. Mainly because the market will learn that some types of Big Data Analytics (BDA) are bigger than others.

The best way to start sorting the Big from the Bigger – to take precedent from other walks of life – is to create some kind of standard or language that allows people to understand what kind of capability exists in a given BDA offering.

The immediate challenge involved in creating any kind of standard in the Big Data world, however, is that there are many different dimensions to consider – does the software have self-learning capabilities? Does it handle input from different senses? Does it segment different types of population? to take just three relatively simple examples.

All of these and more will need to be incorporated into a mature evaluation methodology one day. Today, though, I think we need a place to start, and for me the best place to make that start is by looking at the ‘engine’ of any BDA system – the algorithms that convert the mass of incoming Data into a (hopefully) meaningful set of outputs.

Already, just looking at the world through this lens, we can see a confusing smoke-and-mirrors sea of different types and levels of capability. Probably because few if any BDA providers would like outsiders to see what is – or, more usually, is not under the hoods of their Big Data vehicle.

Here, then, by way of trying to de-mystify things a little is a first attempt to try and distinguish between the various different engines on offer:


BDA Level 1

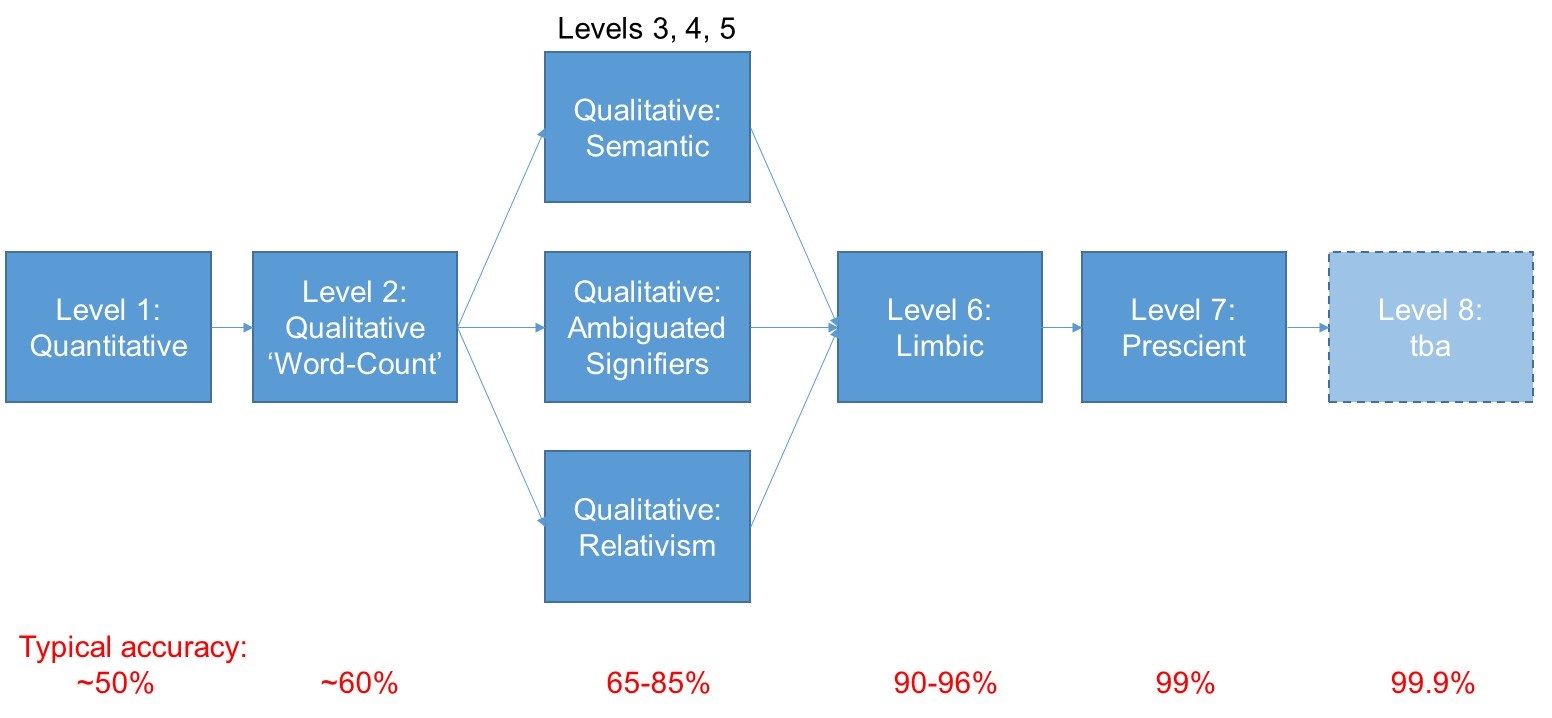
The first thing you observe when attempting to blow the obscuring smoke away is that the large majority of Big Data initiatives are based purely on the analysis of numerical input data. These kinds of quantitative algorithms define what I would say is a very clear ‘Level 1’ capability. They include things like Loyalty Cards and market research questionnaires based on Likert Scale responses from respondees. According to our research, somewhere over 80% of BDA programmes are working at this Level. Some more successfully than others. The Tesco ClubCard, for example, was done early enough and well enough that it became the main driver behind Tesco’s success over the last 20 or so years. Today, sadly for Tesco’s, we start to see the limitations of quant-only Big Data with the supermarket giant currently hitting the headlines for all the wrong reasons: analyzing the numbers will take you so far, but no further in your attempts to understand what goes on in peoples’ heads. Better to know how many people bought your anti-dandruff shampoo last month that not know, but not really that helpful to know how to change things to sell more next month.


BDA Level 2

The key to defining any kind of capability model is to identify the step-change differences between one system and the next. The most obvious first step-change that we see having happened in the BDA world is the shift from quantitative to qualitative analysis; from numbers to words; from star-ratings to narrative. A Level 1, quantitative analysis allows us to see that a reviewer gave their anti-dandruff shampoo a five-star rating. A Level 2 qualitative analysis allows us to gain a few first clues about why they liked the product. The predominant Level 2 BDA output tool right now is the Word Cloud. Which, in essence, is merely a tool for counting the number of times different words appear in a sample of narrative.

word cloud


BDA Levels 3, 4 and 5

So far so good in terms of mapping step-changes in BDA capability. Beyond Level 2, unfortunately, things get a deal more complicated for a while. The problem here is that BDA is a convergence technology in which multiple different research communities find themselves starting from different places, but, because they’re working on the same basic problem – namely how do we improve the accuracy of an analysis of narrative input – all eventually begin to converge on solution strategies that are ultimately complementary to one another. From where I sit, there seem to be three main step-changes that have variously been identified:

  1. Semantic/’Natural-Language-Processing’
  2. Ambiguated Signifiers
  3. Relativism

Any one on its own will improve the accuracy of a Big Data analysis activity, but because different researchers have started from different places, it’s not possible to say that a Semantic-enabled solution is ‘Level 3’, or that a capability making use of Ambiguated Signifiers is ‘Level 4’. There is no ‘right-sequence’ in other words for implementing the different step changes. The ony meaningful way to describe a given capability as one of the different Levels I propose is to say that a Level 3 BDA solution has implemented one of the three possibilities; a Level 4 solution has implemented two of them; and a Level 5 solution has implemented all three.

Here’s a quick guide of the three technologies as they apply in the BDA world:

Semantic/Natural-Language-Processing – comprise algorithms capable of ‘reading’ narrative to the extent that the analysis can extract information relating to the structure of sentences (subject-action-object triads for example). The main benefit obtained from a semantic-enabled BDA capability is its ability to identify and eliminate false-positives from an analysis. It is very easy, for example, to count the number of times the word ‘cross’ appears in a collection of words, it is a deal harder to work out how many of them relate to someone who is angry versus someone who visited Kings Cross recently versus someone who merely wears one. This is the sort of job a semantic analysis capability will do. If it’s a really good semantic engine it will be further be able to identify the sentence negations – i.e. recognizing that someone who’s ‘cross’ and someone who’s ‘never cross’ are very definitely not saying the same thing.

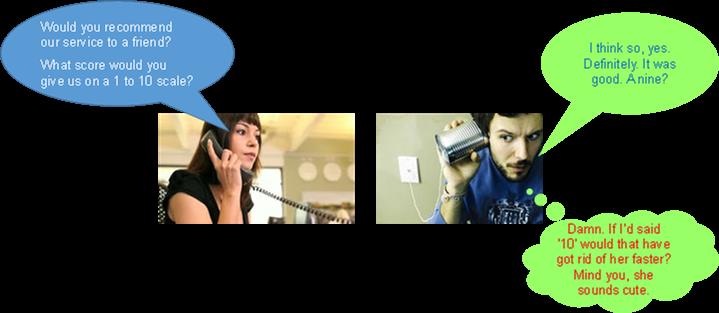
Ambiguated Signifiers – this step change happens on the input side of narrative analysis. It builds on the recognition that when we, for example, ask consumers a question about a product or service, they tend to do one of two things: a) they either ‘gift’ us the answer they think we want to hear, or, b) they ‘game’ the analysis by deliberately setting out to confuse our analysis (hello, GenX’ers!). Either way, when we ask consumers questions like, ‘how likely are you to recommend this product to a friend?’ we’re very unlikely to obtain an answer that is reliable in any way. Ambiguated Signifiers are all about questioning techniques that disguise true intent in such a way that a participant no longer knows how to, or has a desire to gift or game their answers. You can generally spot a BDA provider that has thought about this problem because they’ll tend to ask questions that are either very vague (‘tell me a story about the last time you had dandruff’) or apparently nothing to do with the topic of investigation at all (‘tell me about a situation in which you were embarrassed’).

Relativism – fundamental to the way in which our brain interprets the world is the way we map the relations between things. A person that earns £25K a year will declare themselves to be much happier if their peers all earn 20K than if they all earn 50, even though in both cases they have exactly the same amount of money in their pocket. The BDA implication of this kind of world model is that we’ll get a much more representative answer from an analysis if we ask question that start with ‘compared to…’ or ‘describe a time when you were in a situation like…’ A good ‘relativism’ analysis engine recognizes that the relationships we build between things are at least as important as the things themselves, and that a meaningful analysis needs to examine both. ‘Two substances and a field’ if you’re familiar with TRIZ.


BDA Level 6

By the time you’ve reached Level 5, you’ve eliminated almost every one of the BDA providers on the planet. If you try and look beyond this level, you’re basically left with PanSensics. The start point, in fact, for the PanSensic development was the recognition that a lot of what people say has very little to do with their subsequent behavior. Per the J.P. Morgan aphorism, ‘people make decisions for two reasons, good reasons and real reasons’. Making use of ambiguated signifiers is a useful first step towards capturing the behavior-driving ‘real’ reasons, but the real step change in this direction only occurs when the analytics capability becomes specifically focused on capturing what comes from our limbic brain rather than from our rationalising pre-frontal cortex (PFC). Level 6 BDA is thus all about ‘reading between the lines’ of narrative input to listen to what is coming from our limbic brain. Our JupiterMu metaphor-scraping engine represents a good example of what this Level 6 capability is all about: when you ask a consumer what they think about a product, their rationalizing PFC is hard at work trying to disguise what is happening in the limbic brain. Generally speaking the PFC works fast enough to be able to construct a reasonably coherent set of reasons why we do or don’t like something. Our PFC, on the other hand, is not fast enough to massage and re-engineer the metaphors we use, and so a BDA engine that is tuned to extract and analyse metaphor content is much more likely to capture what’s happening in our behavior-driving limbic brain. In effect, the entire PanSensic research programme has been about tapping in to all of the various different ways to capture limbic-brain content.


BDA Level 7

Capturing what’s happening in our limbic brain is as good as it gets as far as being able to predict how people will behave. It doesn’t, however, represent the end of the journey as far as BDA capability-building is concerned. The ultimate job BDA is there to do is to know what people will do. The key word at Level 7 being ‘will’. As in ‘in the future’. A Level 7 BDA capability – also now a key part of PanSensics thanks to our TRIZ/SI roots – is not just about analyzing what’s happened, but to be able to extract insights into what people will do in the future. It is, in other words, about prescience. From the TRIZ perspective, the key to mapping the future involves finding and then resolving conflicts and contradictions. BDA Level 7, then, is about building in the capabilities to do this job. It’s about uncovering and interpreting the logical (and illogical) inconsistencies that people express when they’re telling a story, and moreover, doing it in a way that allows conflict-solving solutions and strategies to be designed. We’re in the process of testing how best to present this kind of Level 7 insight with some of the dashboards we’re building for clients. One way of doing it has involved the creation of ‘hazard warning lights’ that illuminate when a new opportunity or threat arises as a result of the emergence of some form of conflict.


More on that topic, no doubt, on this blogsite and in the SI e-zine in the not too distant future. Ditto the findings of our current ‘BDA Level 8’ step-change activities. For the moment, though, I suggest that we have at least the bones of a transferable standard by which to assess any given BDA offering. Before you write that big cheque to analyse the petabytes of data sat on your company servers, you might like to think about what level of accuracy and insight you might be looking to achieve from it. Here’s a crude starter for ten:

bda capability

Aphorism Hierarchies?

I love aphorisms. I love them because they’re like little nuggets of truth. I also love them because, no matter what the situation you find yourself in might be, you can always find something to suit the mood. One of the reasons that’s possible is, if you look a little deeper, for every aphorism saying one thing, you can always find another saying the polar opposite. Aphorisms, in other words, contradict one another.

And if there’s anything I love more than aphorisms its contradictions. Contradictions lay at the heart of innovation. Innovation is pretty much all about solving contradictions: finding two conflicting truths and uncovering a higher level truth that allows both the original truths to hold true. So sayeth Hegel in his thesis-antithesis-synthesis model, back at the beginning of the 19th Century.

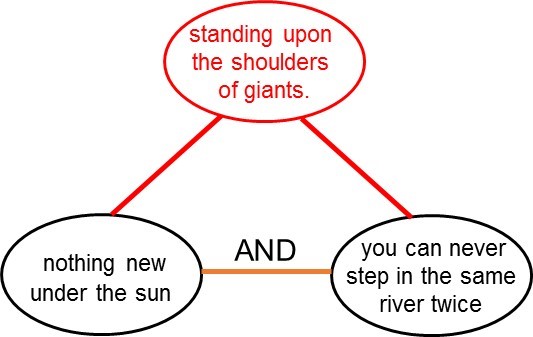
Which all goes to show there is nothing new under the sun. One of my favourite aphorism.

Here’s another one: ‘you can never step in the same river twice’.

Taken together, I think they make an elegant example of a contradictory pair: one says that everything is new, the other says nothing is. So how can they both be true? And if they are representative of a thesis-antithesis pair, what might the synthesis look like?

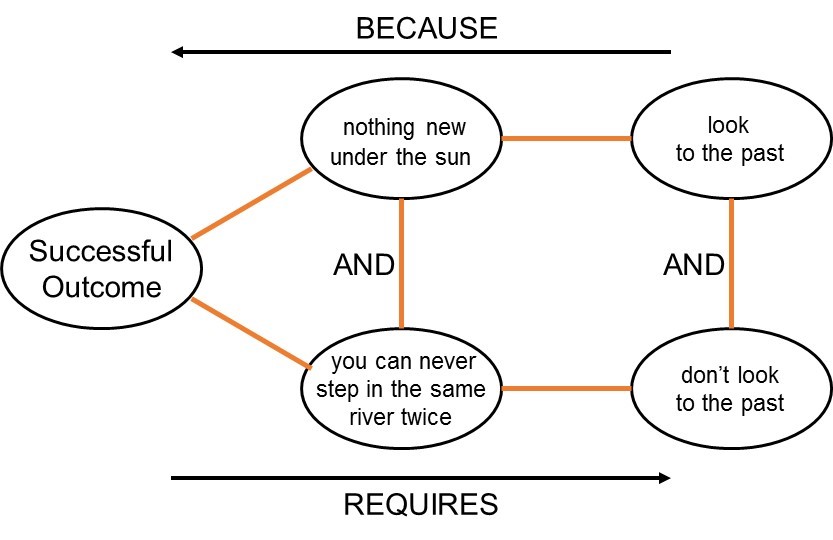
One of the most effective ways to try and solve this kind of puzzle (he would say this wouldn’t he?) is to construct one of the Systematic Innovation ‘Contradiction Maps’. Here’s what I think it might look like for this pair of aphorisms:

metaphorism 1

Looking at this picture as a whole, per its intended function, presents us with a variety of different ways to try and either solve the contradiction or challenge the underlying assumptions that connect each of the bubbles. We get a good clue from looking at the physical contradiction ‘look to the past and don’t look to the past’. We get another one by thinking about the left-hand side of the Map and what ‘successful outcome’ might mean. What’s the successful outcome we’re looking for that would come if both the aphorisms are true?

I think the answer to that question has something to do with learning from the past (not re-inventing the wheel), but simultaneously being able to apply it to solve a problem in a future that will inevitably be unique.

Taking this idea a step further, I think an aphorism that successfully synthesizes a solution to this past/future thesis-antithesis pair is Sir Isaac Newton’s saying, ‘If I have seen further than others, it is by standing upon the shoulders of giants.’ In other words, looking to the past is about working out which giant’s to go and stand on, and not looking to the past, is about standing on those shoulders and looking in to the (unknown) future.

In other words again, I would say that Newton’s aphorism sits at a higher level to the other two:

metaphorism2

Which possibly makes it some kind of ‘meta-aphorism’?

All of which makes me wonder whether it might be possible to repeat such a thesis-antithesis-synthesis trick for every pair of contradicting aphorisms. That’s a piece of research I’d love to see. What intrigues me most about this is whether – per this example – we end up with a meta-aphorim pyramid, on the top of which sits the ‘ultimate’ aphorism, the one that explains life, the universe and everything. Or whether we end up, like a benzene ring, working our way in a gentle arc back to where we started. Do all the aphorims of the world form a hierarchy or a circle? I think we need to know.

Metaphorical Trapdoors

As the post-match analysis of the Scottish Referendum gets into gear, many commentators have already made mention of the likely significance of the barnstorming speech of Gordon Brown given on the day before the voting took place. By any account it was a beautifully constructed and passionately delivered call to arms for the Better Together and ‘undecided’ voters.

From my perspective, it struck exactly the right chords in terms of the heart of the No campaign argument. Our analysis (see previous blog post) to try and establish the core virtuous loops of the argument for ‘Better Together’ suggested there were two things that the No side of the debate would do well to focus on: first, the 3+1>4 synergy effect of being part of the Union, and second, playing on the economic doubts associated with Scottish debt.

Read the speech (http://www.buzzfeed.com/jimwaterson/gordon-brown-delivered-a-passionate-speech-against-independe#zzcu49) and you can quickly see Mr Brown hit the nail squarely on the head on both counts.

Here’s what he had to say on the synergy part of the story:

“So let us tell people of what we have done together.

Tell them that we fought and won a war against fascism together.

Tell them there is no war cemetery in Europe where Scots, English, Welsh and Northern Irish troops do not lie side-by-side. We fought together, suffered together, sacrificed together, mourned together and then celebrated together.

 And tell them that we not only won a war together – we built a peace together, we created the NHS together, we built a welfare state together.We did all this without sacrificing within the union our identity, our culture, our tradition as Scots. Our Scottishness is not weaker, but stronger as a result.”

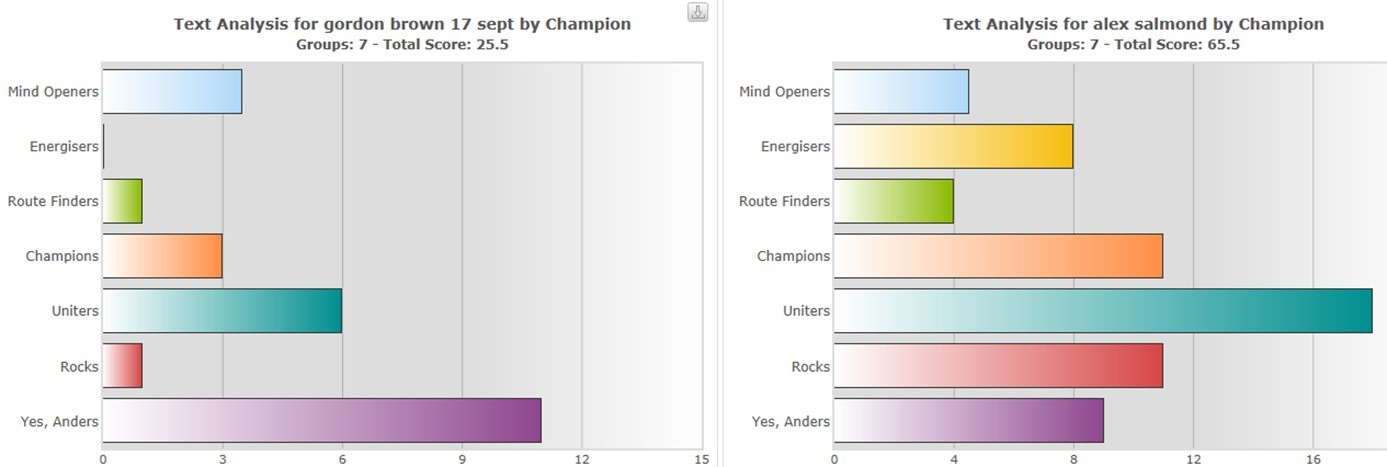
Not only that, when we analyse the entire speech with our PanSensic tools, especially when we compare what Mr Brown said relative to what Alex Salmond was saying in his run up to the start of the vote, we see that the ‘yes, and..’ tone indicative of the synergistic builder was the dominant one across the whole speech:

gordon brown 1

Notice too how, beyond the expected emphasis on the ‘uniter’ tone, Mr Salmond was far less focused overall in his output.

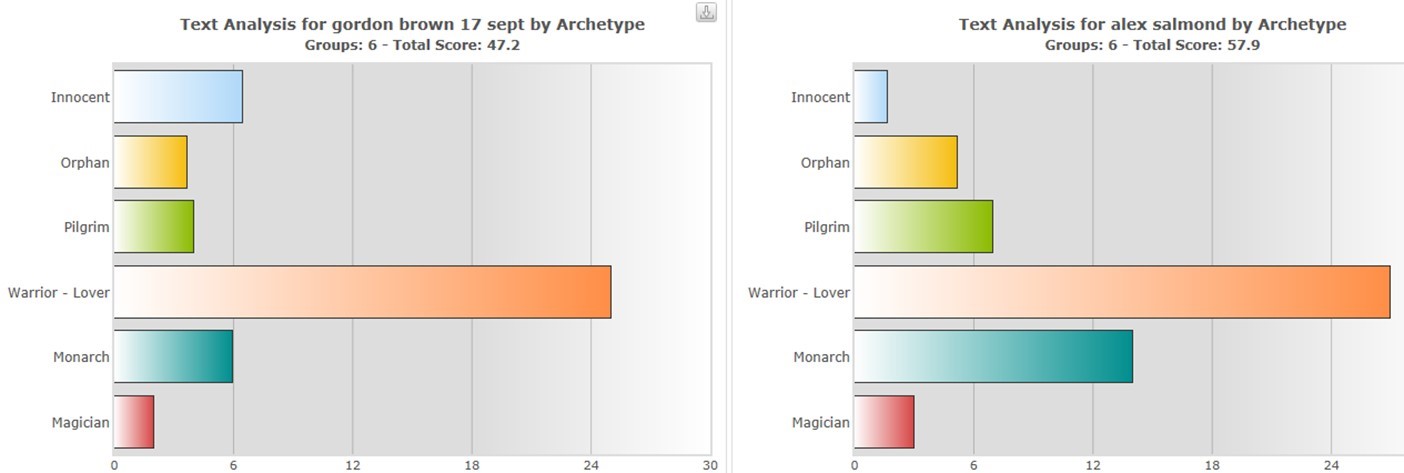
We can see a similar focus characteristic when we look at the Brown and Salmond words through another PanSensic lens, this time looking at emotional archetypes. As we might expect, both featured the ‘warrior/lover’ archetype strongly. But while Brown’s speech was almost exclusively speaking from this archetype, Salmond may well have blurred his position by also speaking from a ‘Monarch’ stance:

gordon brown 2

High ‘Warrior’ archetype scores are closely connected to authority figures that are positioning themselves as the ‘right’ person to tackle issues of fear. Playing on the fear card can always be a tricky one if you don’t get the message exactly in tune with the intended audience. Again, I think Mr Brown got it just right, both from the overall tone perspective, but also through his ‘economic trapdoor’ metaphor and the sentence, seven deadly risks pushing us through an economic trapdoor from which there is no escape’.

Here was what I think will come to serve as a classic ‘word that speaks a thousand pictures’ situation. Not only was it massively subtle in its construction, but it was also evocative enough that all the media picked up on it, and, as a result of that, it planted an unforgettably potent mental image in the mind of anyone that heard it.

And that’s perhaps the ultimate brilliance of the speech. It’s also very likely the lesson we might all take away from this story: understand what the key issues are and then connect them to a powerful visual image that supports your argument. Over the course of what will very likely go down in history as the most striking 13 minutes of his political life, Gordon Brown did exactly that for both of the core issues. Consciously or otherwise, we all went to bed on Wednesday night thinking of trapdoors and British soldiers in war cemeteries.

Scottish Referendum: Perceptions & PanSensics

scotland piechart

The smartest move any English person can make this week would most likely involve staying as far away from discussing or expressing opinions about the Scotland independence referendum as possible. On the other hand, the ongoing debate represents a somewhat unique opportunity to examine and analyse two opposing sets of perspectives to see what they might reveal.

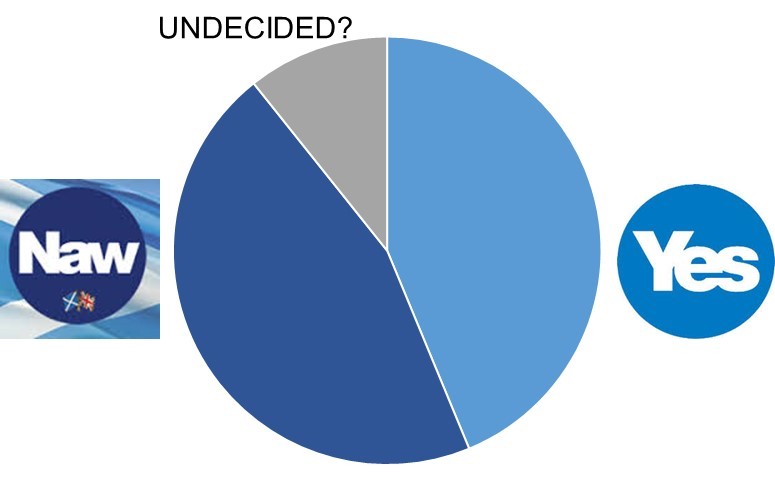
Why, for example, is such a large percentage of the voters still apparently undecided three days before the referendum?

Is there a way to get beneath the noise of the ‘yes’ and ‘no’ campaigns to see what the core issues are?

And, if there are ‘core issues’, what might the politicians best say during these last days of electioneering to get the undecided to land their vote on their side of the debate? Or rather, what should the impartial onlooker be listening out for in the next three days?

In any kind of complex situation like the one in Scotland right now, we tend to use our Perception Mapping process to try and make sense of the things that a group of people are saying about a situation.  This time around, however, we can draw up a pair of Maps – one attempting to make sense of the Yes campaign and one making sense of the No.

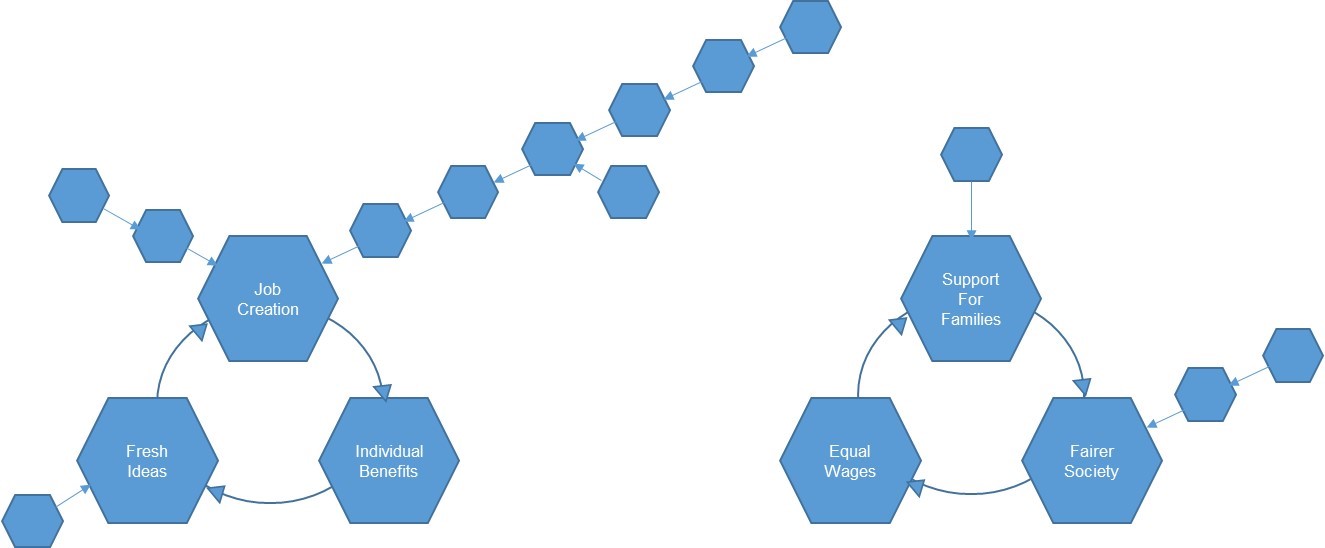
In the Yes campaign, a scrape of the various media commenting on the debate revealed 19 main reasons why Scots should vote ‘Yes’ to independence. Having compiled this list we conducted our usual ‘leads to’ analysis to try and make sense of the relationships between each of the reasons in order to establish what the main issues were. Here’s what the resulting Perception Map looked like:

scotland yes If anyone is interested in looking at the full analysis, we’ll be featuring it in the September issue of the Systematic Innovation ezine to be published after the dust has settled on the Referendum. For now, fosucing on the key points of the Map, the Yes campaign pretty much distills down to two core issues:

  1. A hope that independence will create a virtuous cycle of fairer society, better wage equality and increased importance of the family.
  2. A hope that independence will create a virtuous cycle of job creation, leading to greater individual benefits, fresh ideas and hence even more job creation‘Yes’ advocates would do well to talk convince voters about the validity of these two assumptions. Conversely, ‘No’ advocates would do well to try and show that they are not valid assumptions. Impartial outsiders, might like to watch for evidence of either thing happening in the coming days. If the race is as close as current polls are suggesting, the right words in either of these two directions might just be sufficient to sway the result.

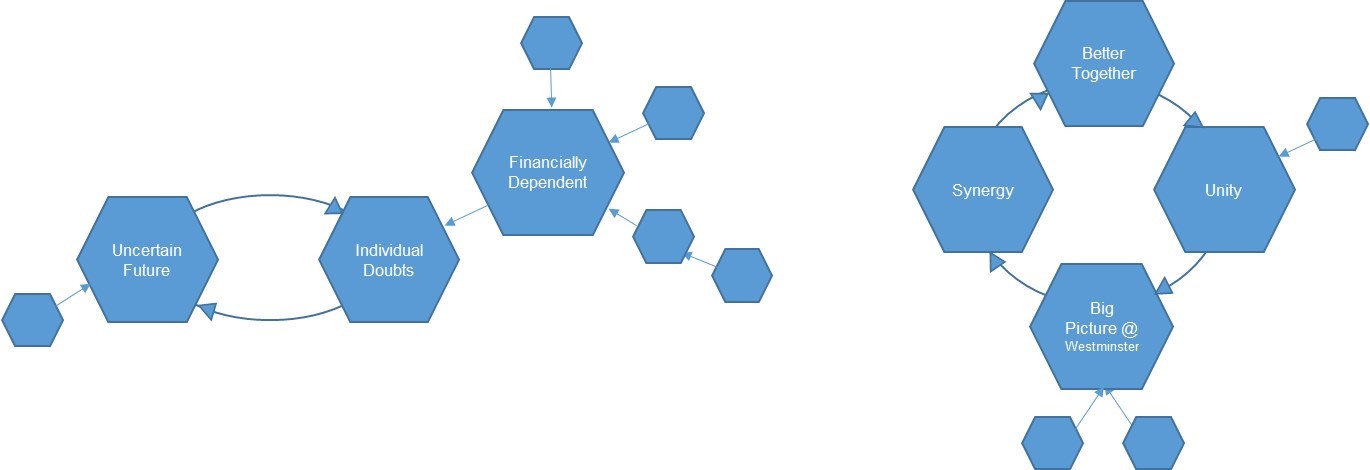
So, what about the No campaign? An equivalent search for reasons to say No was performed across the media, this time revealing a slightly shorter list of perceptions. Here’s what the final Perception Map looks like when we map the relationship between them:

scotland no

Again we end up with two core independent issues:

  1. A downward spiral concerning doubts about the future being expressed both individually and collectively, and driven by the fact that Scotland is currently financially dependent on the UK
  2. A hope that by being part of the Union Scotland opens up the opportunity for greater cross-border unity and synergies coming from the Government in Westminster and their ability to look at the UK from a big picture ‘whole’ perspective.

‘No’ advocates would thus do well to play up the negative uncertainty issue and the positive synergy opportunity. And, conversely again, the ‘Yes’ campaign should be looking to allay the doubt concern and offer up arguments against the synergy opportunity. Impartial outsiders might like to keep a look-out for signs of either set of arguments to again see how the ‘undecided’ might be influenced.

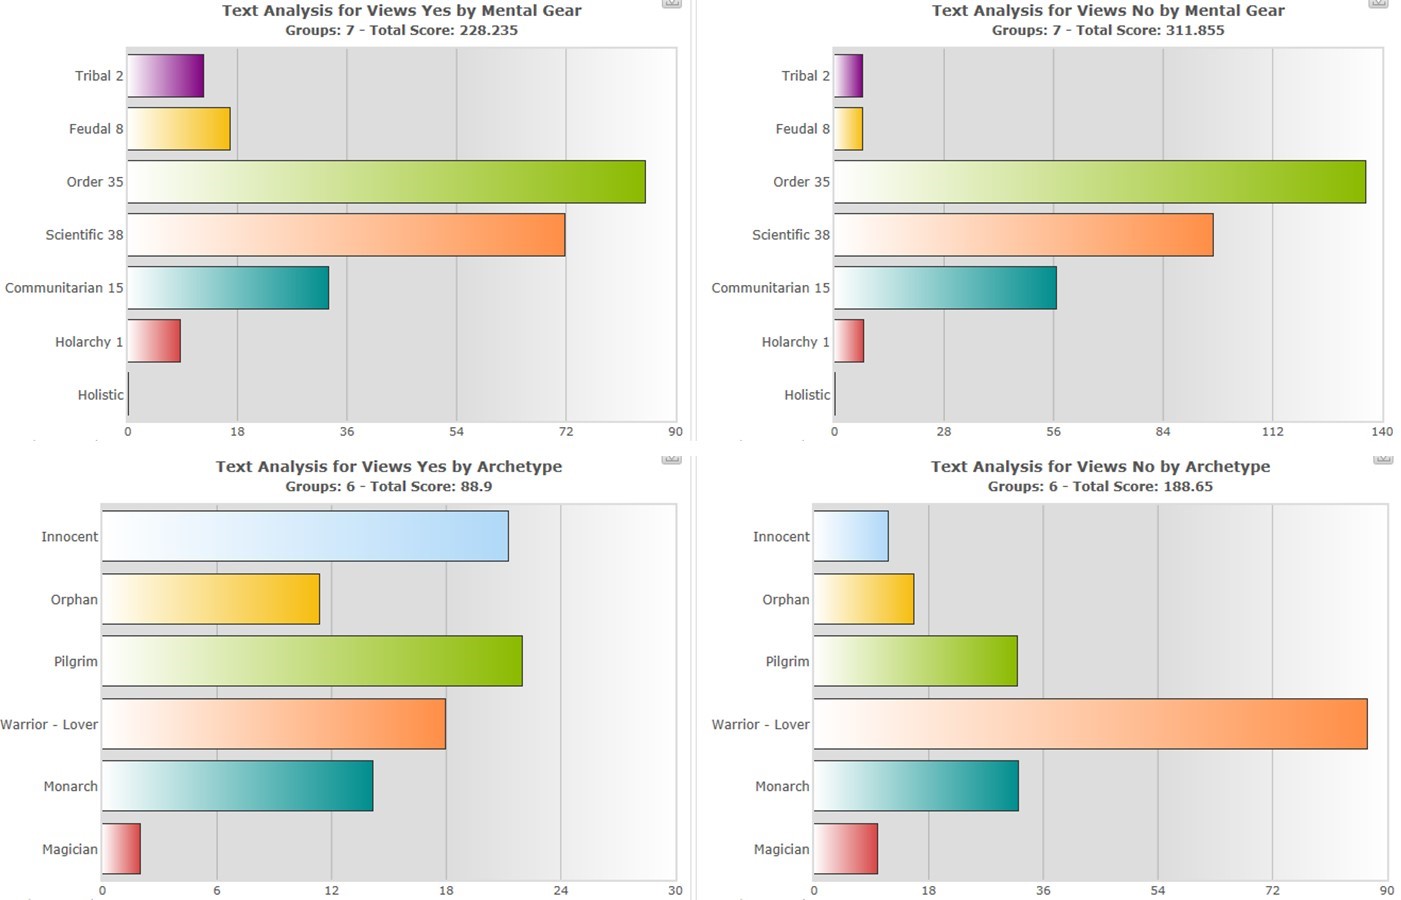
So much for analyzing what people are saying. Perhaps the bigger issue at this point is whether there really are over half a million Scots that haven’t made their minds up yet. This is obviously a much more difficult question to answer, but as such makes it a perfect challenge for our PanSensic toolkit to try and sort out. Here’s another topic requiring a more detailed discussion than is appropriate here. That said, we’ve done a lot of scrapes of what Scots are saying about the Referendum in the past couple of weeks to get a flavor of what’s going on ‘between the lines’. Here are the results of a pair of the PanSensic tools that we’ve used to analyse what’s being said on the ‘Yes’ and ‘No’ sides of the debate:

scotland pansensic

We’ll leave those familiar with PanSensics to try and summarise what this picture is trying to tell us. From my perspective, I think the story they’re trying to tell us is that the polls are likely to be quite significantly in error. And that the ‘No’s will have it by a big enough margin for the pollsters to be concerned about the validity of their techniques. Whether that will result in a surge in interest in PanSensics is rather more difficult to predict <grin>.


People Say Things For Three Reasons

Anyone that’s spent any time at all with anyone from the SI team will have fairly rapidly grown sick of hearing us use the J.P.Morgan aphorism, ‘a man makes a decision for two reasons, the good reason and the real reason’. The idea is that it acts as a reminder to always be thinking about both the tangible and intangible factors that lay behind a decision. Or a piece of communication.

A couple of weeks ago we had a timely reminder that there is often a third reason why people say the things they do. The furore in the UK when Government Minister, Mark Simmonds announced that he was resigning because, to para-phrase, he wasn’t able to live on the salary the government role attracted. When the public learned that this income, including housing allowance, amounted to £120,000 a year, to say there was a lack of sympathy would be one of the understatements of the year.

simmonds


Now, working on the assumption the Right Honourable Mr Simmonds is a smart guy, one is still left wondering what his real reasons behind his resignation might have been. Some internal politicking with the rest of the Conswervative Party, for example, or a desire to protest at an issue he felt strongly about. Something with a ‘pay peanuts, get monkeys’ theme perhaps? He might have a point. But, regarding his ‘good’ reason, using poor salary wasn’t perhaps the best choice in the world.

Given the public outcry that followed his announcement, it feels to me like there was a clear third reason why Mr Simmonds explained the resignation in the way that he did. Maybe people say things for three reasons. The good one, the real one, and the half-baked, ‘didin’t think this one through properly’ reason.

What’s for sure is he certainly didn’t try and see the way his words might be interpreted by his constituency members or the public at large. Or, if he did, there was a striking flaw in his logic somewhere.

To most people in the UK, £120,000 a year represents an awful lot of money. If Mr Simmonds had had them in mind, and had spent no more than another couple of minutes thinking about things, he might well have chosen to give a different ‘good’ reason for his resignation. Had he said, for example, that he was resigning from the Government because his role was forcing him to spend too much time at work and not enough time with his family, he might well have garnered a whole lot more sympathy. Well done, a lot of parents might well have said, someone who’s prepared to give up his career for the sake of his work/life balance and to spend more quality time with his family.

But no, Mr Simmonds succumbed to third-reason logic. Perhaps he was trying to remind us all that foot-in-mouth disease is an ever-present danger. That there is always the possibility that after we’ve thought through our good and real reasons, there’s still one more reason to go.