
With some commentators suggesting that the Big Data Analytics industry will do over $20B of business in 2015, it feels a little duplicitious to suggest anything other than that the industry has become an enormous success. On the other hand, perhaps ironically, it would also appear that the industry is not so good at measuring the tangible success it is delivering to its customers. Or maybe the truth is they don’t want to know.
My suspicion is that were anyone to calculate anything like genuine, meaningful Return On Investment outcomes, we’d discover that the actual value being delivered to customers is somewhere close to zero.
It all depends on how the calculations get made of course. Take my visit to Amazon yesterday to purchase a book someone recommended I should read. As ever, not long after I’ve found the book in question, Amazon is hard at work recommending other things that I might like to buy. ‘If you like that book, we think you’ll like this one even more.’ The fact that I agreed with them on this occasion is very likely to have the Amazon Big Data analysts claiming another success story. They successfully pointed me towards a book I didn’t know about and offered it to me at a price that, after I’d done my usual due diligence check, made it feel like an easy purchase decision. But was this really a Big Data success story? Or was it merely getting me to an important book I’d didn’t know about sooner rather than later?
The heart of the problem here is how the Big Data world takes account of the foibles and complexities of customer minds. And therein lays the real problem with today’s Big Data analysts. They’re good at analysing easy to access data (25% of people who bought this book also bought this one) but they have little or no idea how complex systems work. And particularly the rather awkward matter concerning the inextricable links between what we measure and the solutions that are expected to result. You can only know what to measure, in other words, if you know what the response you’re trying to design is going to look like. Designing measures in a complex system involves a classic chicken-and-egg conundrum. If that sounds counter-intuitive to you, you only need to think about a typical design cycle to see that, woah, it’s a cycle. The head connects to the tail so that no-one knows where the head is any more. Some projects might start with a measurement, but others might equally well start by guessing a solution and then measuring what happened to it.
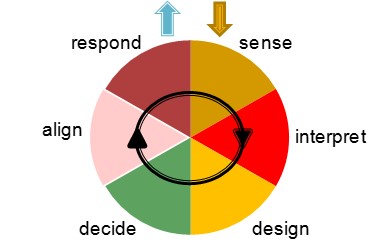
In the world of complex systems it is not good enough to be merely good at ‘Sensing’. You have to know how to Interpret, Design a response, Decide that it’s appropriate, Align the team and then execute a Response.
The ‘system’ requires all these elements, but the two that demand the polar opposite set of skills are Sensing and Designing. One is about analysis; the other about synthesis. Because the Big Data world tends to attract the former, it tends to be awful at the latter. The problem usually then becomes exacerbated because the Big Data analysis work is often out-sourced from the client organisations that are going have to do something with the results. Now you have a situation where the Analysts and the Synthesists are on opposite sides of a big silo wall. And so the blind find themselves being lead by the ignorant.
The point of this rant? With our PanSensic toolkit the Systematic Innovation team now finds itself sitting in the middle of what feels like a very crowded Big Data Analytics space. Aside from the cool measurement tools we’ve been able to build, I humbly suggest that our main uniqueness when we’re working with our clients is that our DNA sits on the Designer/Synthesist side of the spectrum. We spend most of our lives designing solutions. And because that’s where we come from, that’s what’s allowed us to gain the insight we have into knowing what the ‘right’ things to measure are.
99% of Big Data measurmeents, by our reckoning, are completely pointless because they offer zero insight into what design levers need to be created or pulled to make a difference. Hospitals spend millions measuring A&E waiting times, railway operators spend their millions calculating how punctual their trains are, supermarkets spend their millions measuring what went into my trolley this month, but all three measurements are thoroughly pointless when it comes to presenting any actionable change response. All their beautiful graphs, especially with the hospitals and railways, merely serve to frustrate both staff and customers, because none of us can see any kind of connection between the result and any kind of lever in or around the system that we can adjust to make the results look better next month.
So, how about this as a potential way through the rat’s nest of Big Data Analytics conundrums. A suggested trio of questions a leader should ask prospective Big Data providers before they write their Big Data Cheques:
- Show me evidence to demonstrate that you understand how my business operates as a Complex Adaptive System
- Show me evidence of success stories from other clients where you are able to demonstrate a clear information flow path and cycle time from measurement through Interpretation, (especially) Design, Decision, Alignment and a successful Response.
- Show me evidence of a back-to-back, double-blind trial in which your Big Data Analytics approach was demonstrably better than the placebo.
And, by way of a final coda, if they think they can answer questions 2 and 3, it probably tells you they didn’t quite understand Question 1.